In this tutorial, you will learn about conditional breakpoints in Visual Studio. Breakpoints are an important debugging feature, and the Visual Studio IDE allows you to set up triggers on your breakpoints.
What is a Breakpoint?
A breakpoint is a debugging tool that allows you to pause the execution of your code at specific points. The most common type of breakpoint is one that will pause your program at a specific line of code.
To use Breakpoints in Visual Studio, simply left click to the left of the line number where you wish to pause your code. You will see a red circle appear on the line with the breakpoint.
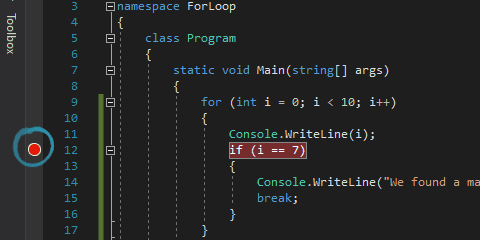
For this example, I have re-opened a previous tutorial. In the image above, I have set a breakpoint on Line 12. If I were to run my program in debug mode at this point, it would run through Line 11 and print the value of i to the console, where i = 0, and then it would pause before executing Line 12.
While the program is paused at a breakpoint in debug mode, there a number of useful things you can do.
- You can see the current value of local variables.
- You can change the value of those variables.
- You can change which line of code will be executed next.
Visual Studio Debugging Tools
One of the useful tools that the Visual Studio debugger offers is the ability to monitor the value of local variables. While your program is paused at a breakpoint, you will see a window appear at the bottom of the screen.
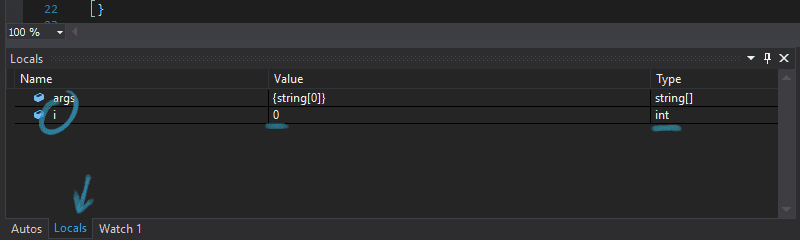
Open the Locals tab, and you will see all the variables that are in scope at the current point in the code's execution. In our example, we see the value of our Integer variable i.
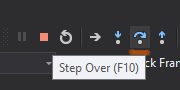
To execute just the current line of code (Line 12 in this case) and pause again, we will use the Step Over feature by pressing F10 on your keyboard or by clicking the middle icon in the Debug - Step menu.
If you were interested in jumping in to the method being called, you could use the Step In feature by pressing F11 on your keyboard or by clicking the left icon in the Debug - Step menu.
To run the program until you reach another breakpoint, you will use F5 on your keyboard or press the Continue button in the menu.
Using Conditional Breakpoints
It can be laborious to repeatedly step over our code until we find the exact condition we are looking for. Fortunately, the Visual Studio debugger has a very useful Conditional Breakpoint feature. This feature allows us to add specific triggers on top of our breakpoint. For example, we could configure our breakpoint not to trigger until the value of some variable equals a certain value.
To use conditional breakpoints, set a breakpoint on the desired code line as you did above. Then, hover over the red breakpoint indicator and click the Settings... icon.
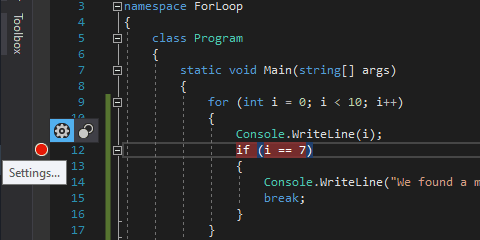
From here, you can enter specific trigger conditions for your breakpoint. In our example, we could configure the breakpoint not to trigger until the value of our counter variable i is equal to 7. To do this, check the Conditions option and select Conditional Expression where Is true i == 7, as shown below.

From the breakpoint settings menu, you can also specify actions to perform when the given line of code is reached. It can be useful, for example, to log the values of variables to the Output window instead of using the Locals window to monitor them. If we are trying to debug a loop and there are certain variables we are interested in, it can be helpful to log the values of those variables to the output window each time the loop iterates. This way we can see their values all in one place and more easily identify patterns and errors.
The Bottom Line
Visual Studio is widely considered among the best Integrated Desktop Environments, and that is partly because of the abundant debugging tools that it offers. In this tutorial, you have learned about some of the most fundamental debugging features, including breakpoints and monitoring variable values. In addition, you have learned how to use conditional breakpoints, which are particularly useful as you begin debugging more complex C# applications.
Don't stop learning!
There is so much to discover about C#. That's why I am making my favorite tips and tricks available for free. Enter your email address below to become a better .NET developer.
Did you know?
Our beautiful, multi-column C# reference guides contain more than 150 tips and examples to make it even easier to write better code.
Get your cheat sheets