It is common for IoT solutions to use sensors to log data over time. In this electronics tutorial, you will use a Meadow microcontroller board and an LM35 analog temperature sensor to collect weather data. Then, you will post that data to a web API and store it in a database using EF Core. Finally, you will fetch data from the database and display it using Blazor. Ready to get started?
Wiring the Circuit
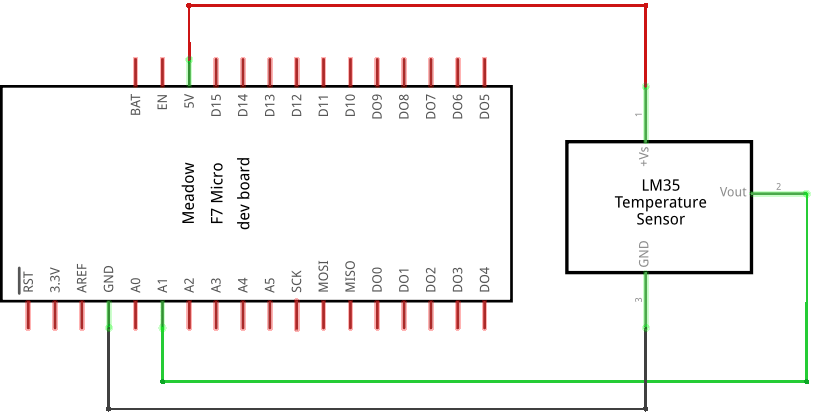
The electronics circuit for this project is simple. You will be using a single LM35 (or similar) analog temperature sensor. This sensor has three legs: +VS, GND, and VOUT. The LM35 can be powered by any source between +4V and +20V, so you can connect the +VS pin to the +5V output supplied by the Meadow board. Connect the sensor's GND pin to the ground pin on Meadow. Finally, connect the output leg of the temperature sensor, VOUT, to an available analog IO port on Meadow. In the following schematic diagram, I have it connected to A1.
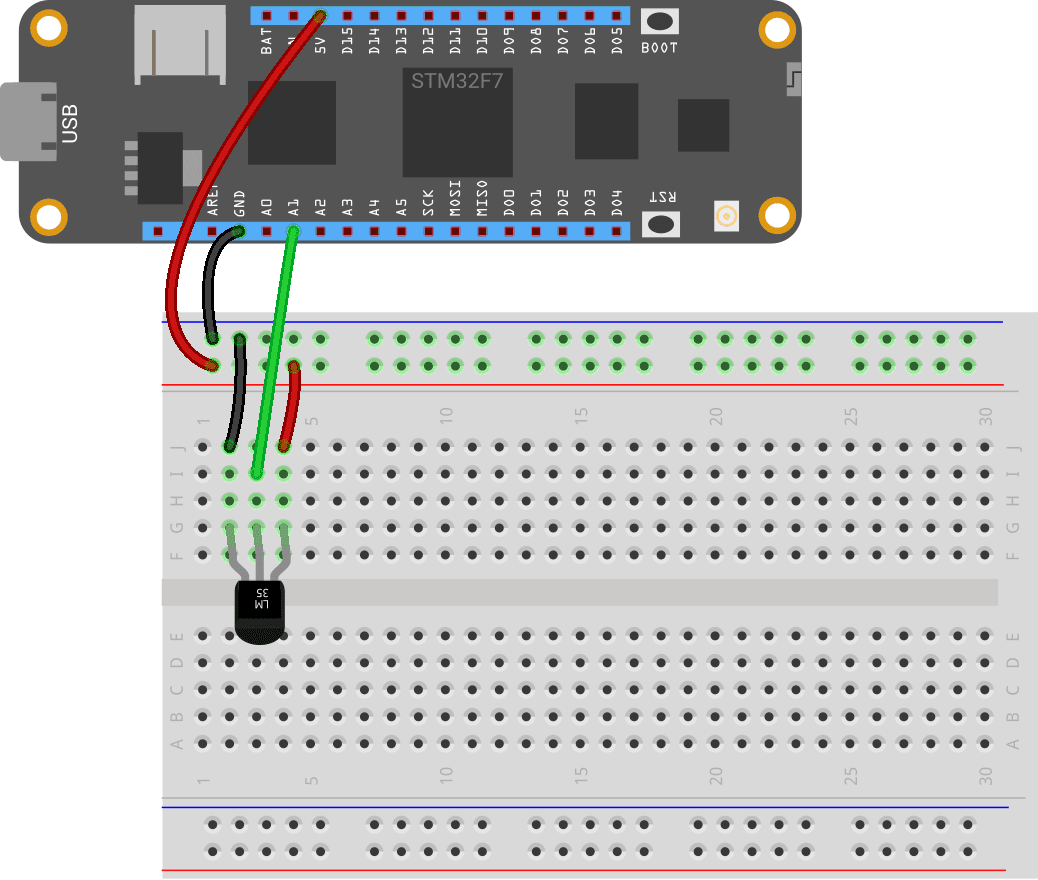
You may also refer to the following wiring diagram.
Meadow Code
There are several components on the microcontroller portion of this project. First, you must configure and initialize the temperature sensor. Next, you will enable wireless networking and connect to a WiFi network. Finally, you will use an HttpClient object to periodically POST the obtained temperature data to a Web API. We will write the Web API code in the next section.
Configure Temperature Sensor
Initializing the temperature sensor is straightforward. Create a new Meadow Application project and open MeadowApp.cs. Start by declaring an AnalogTemperature variable. Create an Initialize() method and invoke the method from the MeadowApp() class.
AnalogTemperature temperatureSensor;

public MeadowApp()
{
    InitializeTemperatureSensor();
}

private void InitializeTemperatureSensor()
{
    temperatureSensor = new AnalogTemperature(
        device: Device,
        analogPin: Device.Pins.A01,
        sensorType: AnalogTemperature.KnownSensorType.LM35
    );
    temperatureSensor.TemperatureUpdated += TemperatureUpdated;
    temperatureSensor.StartUpdating(updateInterval: TimeSpan.FromSeconds(5));
}
In this example, the sensor is configured as a LM35 temperature sensor connected to analog pin A01. If you are using a different known temperature sensor, such as a TMP36, or if your sensor is connected to a different port on the Meadow board, be sure to make the appropriate adjustment.
You will also notice that an event handler has been added to respond when the TemperatureUpdated event of the temperature sensor is raised. This is where you will notify the web API of the new temperature values, and the web API can then store the values in a database. For now, simply test that the hardware is working by printing the temperature to the console.
private void TemperatureUpdated(object sender, IChangeResult<Temperature> e)
{
    Console.WriteLine(e.New.Celsius);
}
To start sampling from the sensor, call the StartUpdating() method. The updateInterval parameter sets how often the sensor should poll for new data. Using TimeSpan.FromSeconds(5), for example, will fetch a new temperature reading every 5 seconds.
Configure Wifi
Configuring wireless networking on Meadow is a standard procedure. Create a new async method called InitializeNetworkingAsync().
private async Task InitializeNetworkingAsync()
{
    if (!Device.InitWiFiAdapter().Result)
    {
        throw new Exception("Could not initialize the WiFi adapter.");
    }

    var connectionResult = await Device.WiFiAdapter.Connect("SSID", "password");
    if (connectionResult.ConnectionStatus != ConnectionStatus.Success)
    {
        throw new Exception($"Cannot connect to network: {connectionResult.ConnectionStatus}");
    }
}
Be sure to replace the SSID and password values with the values corresponding to your own wireless network. Invoke this method within your Meadow app.
public MeadowApp()
{
    InitializeTemperatureSensor();
    InitializeNetworkingAsync().Wait();
}
You might also add a a method to configure Meadow's onboard real-time clock by fetching the current date/time from a public web API. Refer to the source code for the project for details.
POST to Web API
In order to display the temperature history in a pretty chart, you will want to pass both the temperature and the time to Web API server. Create a new model class file called TemperatureData.cs.
public class TemperatureData
{
    public DateTime DateTime { get; set; }
    public double TemperatureC { get; set; }
}
To send the temperature data to the web API server, you will make an asynchronous HTTP POST request. Update the TemperatureUpdated() method you created earlier and add the async modifier.
private async void TemperatureUpdated(object sender, IChangeResult<Temperature> e)
{
    Console.WriteLine(e.New.Celsius);

    TemperatureData temperatureData = new TemperatureData { DateTime = DateTime.Now, TemperatureC = Math.Round(e.New.Celsius,1) };

    await UploadTemperatureDataAsync(temperatureData);
}
As you can see, this method creates an object instance of the TemperatureData class you just wrote and uses it to store the current DateTime and Temperature values. I elected to round the temperature to the nearest tenth of a degree Celsius. Finally, it passes the temperature data to an UploadTemperatureDataAsync() method.
Create a class-level static HttpClient instance.
static readonly HttpClient httpClient = new HttpClient { BaseAddress = new Uri("http://192.168.1.5:5000/") };
The important thing to know here is that the base address should correspond to the IP address of the Web API, which you will write in the next step. The UploadTemperatureDataAsync() method will rely on this instance of HttpClient.
public async Task<HttpResponseMessage> UploadTemperatureDataAsync(TemperatureData temperatureData)
{
    string jsonTemperature = JsonSerializer.Serialize(temperatureData);
    var stringContent = new StringContent(jsonTemperature, System.Text.Encoding.UTF8, "application/json");

    HttpResponseMessage response = new HttpResponseMessage();
    try
    {
        response = await httpClient.PostAsync($"api/temperature", stringContent);
    }
    catch(Exception e)
    {
        response.StatusCode = HttpStatusCode.InternalServerError;
        response.ReasonPhrase = $"{e.Message}";
    }
    return response;
}
This method receives the temperature data, serializes it into a JSON string, and makes an HTTP POST request to the API controller endpoint located at http://192.168.1.5:5000/api/temperature.
Note: If you are using Meadow b5.1 targeting .NET Standard 2.1, System.Text.Json will be broken. You can use Newtonsoft.Json as a temporary workaround until a new version of Meadow OS is released.
Web API Code
Add DbContext
For the purposes of this project, you will simply add the web API controller as an endpoint within your Blazor web application. If you prefer, feel free to add the web API as a separate project. Start by creating a new server-side Blazor web app.
With EF Core 5.0, a built-in factory is available for creating new DbContext instances, so this is the approach you will take for injecting as a dependency into both the web API and Blazor web app. If your project does not already have a Data folder, create one and add a new model class for the EF Core entity.
public class TemperatureData
{
    [Key]
    public long Id { get; set; }
    public DateTime DateTime { get; set; }
    public double TemperatureC { get; set; }

}
Next, create a class that implements DbContext.
public class TemperatureDataContext : DbContext
{
    public TemperatureDataContext(DbContextOptions<TemperatureDataContext> options)
        : base(options)
    {
    }

    public DbSet<TemperatureData> TemperatureData { get; set; }

}
Finally, add the factory to dependency injection in the ConfigureServices() method of Startup.cs. For this demo, I will just use an in-memory database, but in a real-world application, you could use a SQL server.
services.AddDbContextFactory<TemperatureDataContext>(options =>
        options.UseInMemoryDatabase("TemperatureData"));
Add Controller
To add an API controller to a Blazor application, add a folder called Controllers and create a new empty API controller class called TemperatureController. Fetch an instance of the DbContext from the DbFactory, which is passed through dependency injection.
private readonly TemperatureDataContext _context;

public TemperatureController(IDbContextFactory<TemperatureDataContext> dbFactory)
{
    _context = dbFactory.CreateDbContext();
}
This controller needs a single HttpPost endpoint that will receive the serialized object and save it to the database.
[HttpPost]
public async Task<ActionResult<TemperatureData>> PostTemperatureData(TemperatureData temperatureData)
{
    _context.TemperatureData.Add(temperatureData);
    await _context.SaveChangesAsync();

    return CreatedAtAction(nameof(GetTemperatureById), new { id = temperatureData.Id }, temperatureData);
}
Now that the controller is ready, be sure to add controllers and map the route to an endpoint in the ConfigureServices() and Configure() methods of Startup.cs.
public void ConfigureServices(IServiceCollection services)
{
    ...

    services.AddControllers();
}
public void Configure(IApplicationBuilder app, IWebHostEnvironment env)
{
    ...

    app.UseEndpoints(endpoints =>
    {
        endpoints.MapControllers();
        endpoints.MapBlazorHub();
        endpoints.MapFallbackToPage("/_Host");
    });
}
Blazor Code
Install Chart.js
When debugging a Blazor app, it is easy to make the site accessible to other devices on the network by making a small change to launchSettings.json in your project's Properties directory. Adjust the applicationUrl property for your project's launch profile (not IIS) from http://localhost:5000 to the IP address where your Blazor app will be running, for example http://192.168.1.5:5000.
Your Blazor web app will contain a single page that will be used to fetch the latest temperature values from the database and display it in a chart. We will use a wrapper for Chart.js for the graph. Install the Nuget package from the Package Manager Console with the following command.
Install-Package ChartJs.Blazor.Fork
To use Chart.js, you must add references to its static assets in your Blazor app's Pages/_Host.cshtml file.
<script src="https://cdnjs.cloudflare.com/ajax/libs/moment.js/2.29.1/moment.min.js"></script>
<script src="https://cdn.jsdelivr.net/npm/chart.js@2.9.4/dist/Chart.min.js"></script>
<script src="_content/ChartJs.Blazor.Fork/ChartJsBlazorInterop.js"></script>
Fetch Data and Configure Chart
Since the project consists of a single page, you can simply modify the existing Index.razor page in the Pages folder. Start by importing the required namespaces for both Chart.js and EF Core.
@page "/"
@using ChartJs.Blazor
@using ChartJs.Blazor.Common
@using ChartJs.Blazor.Common.Axes
@using ChartJs.Blazor.Common.Enums
@using ChartJs.Blazor.Common.Time
@using ChartJs.Blazor.Util
@using ChartJs.Blazor.LineChart
@using Microsoft.EntityFrameworkCore
Next, inject an instance of the DbContextFactory interface.
@inject IDbContextFactory<TemperatureDataContext> DbFactory
To place a chart on the page, use a Chart element.
<Chart Config="_config"></Chart>


@code{
    private LineConfig _config;
    private IDataset temperatureDataSet;

}
You will notice a LineConfig variable, which will be used to set the look and feel of the chart as well as interactivity and tooltip options. You will also notice a variable temperatureDataSet that will be used to define the data used to populate the graph.
To configure the chart's appearance, override the page's OnInitialized() method. The LineConfig options define details about the chart, such as the title and labels. In addition, each dataset can also be configured with its own options to set things like line color. The best way to learn what each property does is to experiment and observe.
protected override void OnInitialized()
{
    _config = new LineConfig
    {
        Options = new LineOptions
        {
            Responsive = true,
            Title = new OptionsTitle
            {
                Display = true,
                Text = "Temperature from Meadow"
            },
            Tooltips = new Tooltips
            {
                Mode = InteractionMode.Nearest,
                Intersect = true
            },
            Scales = new Scales
            {
                XAxes = new List<CartesianAxis>
                {
                    new TimeAxis
                    {
                        Time = new TimeOptions
                        {
                            TooltipFormat = "ll HH:mm:ss"
                        }
                    }
                }
            }
        }
    };

    temperatureDataSet = new LineDataset<TimePoint>
    {
        Label = "Temperature (°C)",
        BackgroundColor = ColorUtil.FromDrawingColor(System.Drawing.Color.Blue),
        BorderColor = ColorUtil.FromDrawingColor(System.Drawing.Color.Blue),
        Fill = FillingMode.Disabled
    };
}
This chart will pull data from a List of TemperateData objects retrieved from the database. Fetch the data from the DbContext by overriding the OnParametersSetAsync() method. For this demo, I am only fetching the 10 most recent entries.
    protected override async Task OnParametersSetAsync()
    {
        using var context = DbFactory.CreateDbContext();

        List<TemperatureData> Temperatures = await context.TemperatureData.OrderByDescending(t => t.DateTime).Take(10).ToListAsync();

        await base.OnParametersSetAsync();
    }
}
Now that you have the data from the database stored in a List object Temperatures, you can set the chart's dataset to use the DateTime values for the time scale (x-axis) and the double TemperatureC values for the y-axis. To do this, pass each datum as a TimePoint instance to the dataset and tell the chart to use the dataset by adding it to the chart's configuration property.
    protected override async Task OnParametersSetAsync()
    {
        using var context = DbFactory.CreateDbContext();

        List<TemperatureData> Temperatures = await context.TemperatureData.OrderByDescending(t => t.DateTime).Take(10).ToListAsync();

        foreach (var t in Temperatures)
        {
            temperatureDataSet.Add(new TimePoint(t.DateTime, t.TemperatureC));
        }

        _config.Data.Datasets.Add(temperatureDataSet);

        await base.OnParametersSetAsync();
    }
}
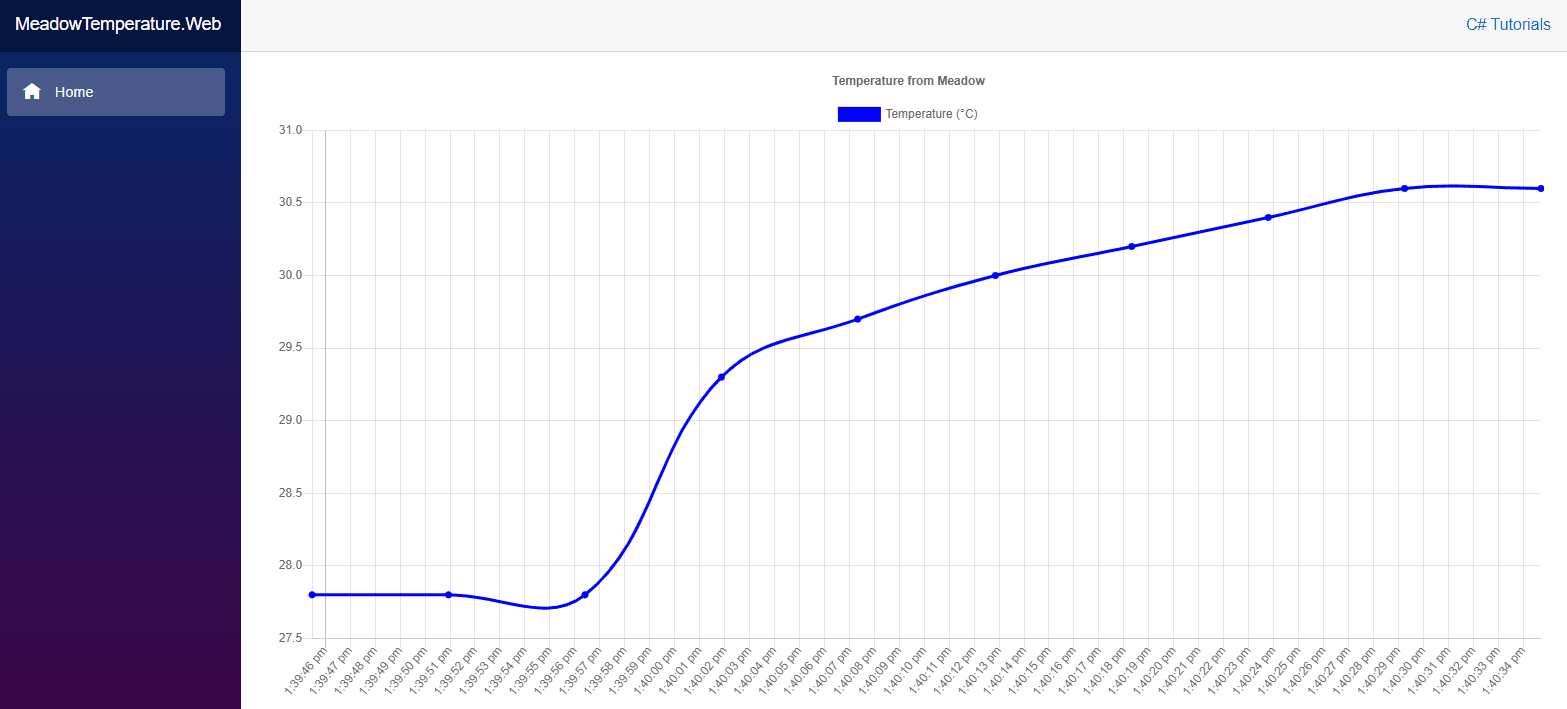
Now you are ready to deploy the Meadow app to your microcontroller and launch the Blazor web app.
The Bottom Line
In this project, you learned how to use a Meadow microcontroller to sample real-time data from a sensor and upload the data to a web server through an API endpoint. You also created a Blazor web app to pull data from the web API and display it as a graph using Chart.js. In this demonstration, we only collected temperature data, but you could use the same technique to create any number of complete IoT solutions. For example, you could expand on this project to create a comprehensive weather station that also collect humidity and air quality data. You could create a security solution to monitor spaces for movement by using motion sensors. You could even capture and transfer images as part of a live camera solution. The imagination is the limit!
Source code for this project is available on GitHub.
Did you know?
Our beautiful, multi-column C# reference guides contain more than 150 tips and examples to make it even easier to write better code.
Get your cheat sheets